Thermal Expansion

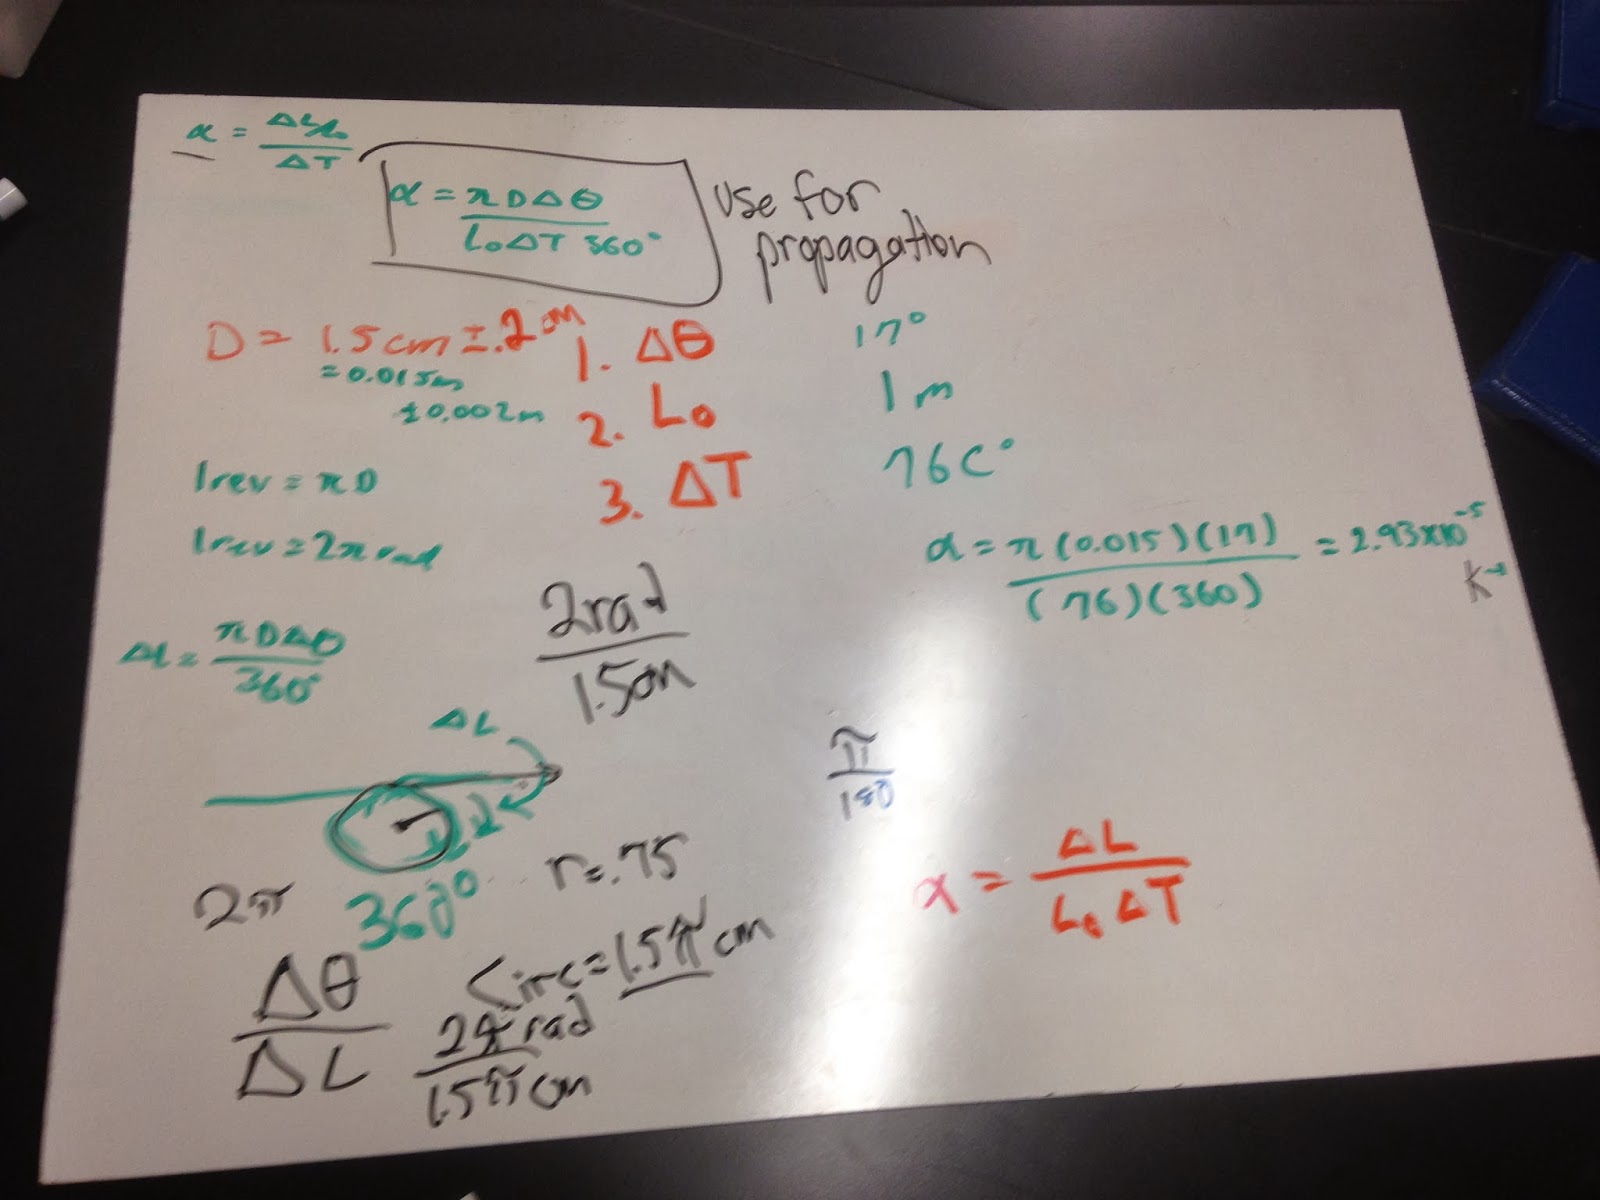
This is were we evaluated the expansion rate of a metal rod with steam used as a heating source. the expansion of the rod would then move along the circumfrence of a circular measuring device. From these results we were able to calculate the expansion rate of the rod leading us to the probrable material of the rod.

using the uncertainty in the distance we were able to evaluate the uncertainty in the expansion rate of the rod using partial differentiation. using this we are able to cover our uncertainty in our answer which could have arised from the measurement of the distance the rod moved.

this was the graphical results from the steaming of the rod. this showed how the rise in temperature expanded the rod at a linear rate.
Latent heat of Vaporization

this is the set up of recording the boiling point of the water for a period of time to measure the amount of water evaporated in order to calculate the latent heat of vaporization.

This is our graphical results where we measured the length of time the water was boiling. This shows how the temp of the water will increase until just below 100 degrees Celsius and stay at that temp until all the water turns into vapor.

using the power, change in time and mass we were able to calculate the latent heat of vaporization for water. This did differ from the actual value of 2.2*10^6 because we did not take into account the water was evaporation as the temp was rising which would have gotten us closer to the actual value.

Using excel I calculated the standard deviation of the classrooms results and found that our results varied greatly between the average. from this it is saying that our values fall from 1779300+_ 858363. this is a wide spread due to the out lire that increased our standard deviation.

This is our prediction of how pressure is inversely proportional to the volume so as the pressure increases the volume decreases.

when we tried this experiment we were able to prove the relationship graphically. the slope represents the number of moles of gas.

This was the setup for the pressure vs volume where we used a syringe to apply pressure.

This is where we showed the pressure vs temperature where we showed that there is a linear relationship between pressure and temperature. the meaning of the constant represents the universal gas law constant.

this is the graphical representation of the pressure vs temperature where we were able to obtain the slope of the graph which is close to the universal gas constant.
No comments:
Post a Comment